Over the past few years, Google has been fitting many of their Street View cars – which are a familiar sight in towns and cities all around the world – with pollution sensors designed to track
air quality in urban areas.
Over the past few years, Google has been fitting many of their Street View cars – which are a familiar sight in towns and cities all around the world – with pollution sensors designed to track
air quality in urban areas. Over the past six years, these cars have collected more than 100 million air quality measurements, helping to populate detailed air quality maps for use at a local
level by Governments, academics, businesses and citizens alike. As explained by the Google team: “these hyperlocal air quality measurements are helping governments and communities make more informed
choices about changes that can help city residents breathe cleaner air”. You can read more about Google’s global cleaner air initiative here: https://blog.google/products/maps/100-million-air-quality-measurements-with-air-view/
Air Quality in Ireland
In Ireland, Sonitus Systems is delighted to support Google and our client Dublin City Council, who are working together to roll out this initiative across Dublin. The Air View Dublin partnership
will see Google’s first-ever, all-electric Street View car (a Jaguar I-PACE) deployed around the city to measure air quality over the next 12 months. The car equipment is able to measure nitrogen
dioxide (NO2), nitric oxide (NO), carbon dioxide (CO2), carbon monoxide (CO), fine particulate matter (PM2.5), and ozone (O3). You can read more about this Irish initiative through the Dublin air and
noise website, powered by Sonitus Systems: https://dublincityairandnoise.ie/assets/docs/Air-View-Press-Release-May2021.pdf
Air Quality in Copenhagen
This method of mapping hyperlocal air quality by Google was done in Copenhagen back in 2018. The map (below) shows the levels of nitrogen dioxide (NO2), black carbon, and ultrafine particles in
each area. This detailed street-by-street mapping revealed that Copenhagen’s major access roads have nearly three times more ultrafine particles and nitrogen dioxide (NO2) and five times higher black
carbon levels than less trafficked residential areas. This data and air quality insights prompted urban planners locally to strategically design future neighbourhoods that include ‘Thrive Zones’,
ensuring schools and playgrounds are located away from high-pollution zones.
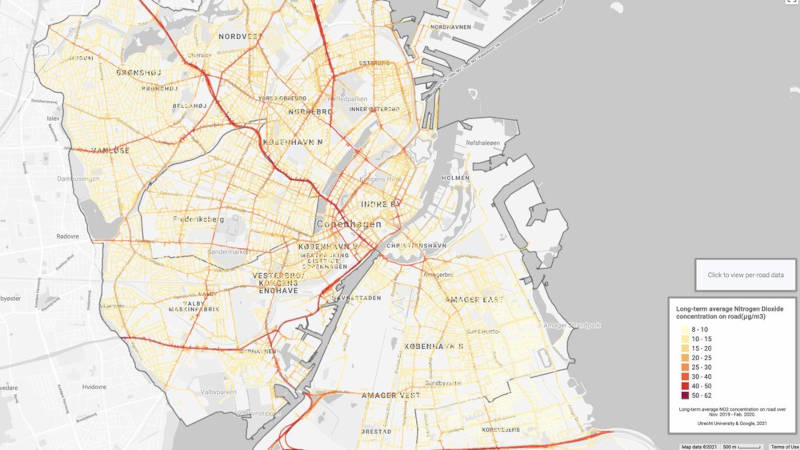
This air quality map shows the street-by-street average of nitrogen dioxide (NO2). Utrecht University & Google, 2021.
What’s Ahead for Project Air View
According to the website, Google’s air quality insights generated through Project Air View will be integrated into the European Commission-funded European Expanse project, which is researching the
health and welfare implications of poor air quality on the citizens of European. The outcomes of this research are expected to inform policy-making at a local, State and European level.
Project Air View complements the ongoing smart cities initiatives of many cities around Europe that are currently tackling a range of environmental issues at a local level. Speak to the Sonitus Systems
team about the options available for monitoring, measuring and reporting on such issues.
Sonitus Systems offers both the hardware and software for a range of environmental parameters on a continual basis, with real-time information available through our Sonitus Cloud dashboard.
For more details on our indoor and outdoor noise and air quality monitoring products and services, please contact the team at www.sonitussystems.com/contact/contact.html